

In a change from the regular content, I’ve decided to talk about something that I enjoy, baseball. I set out to make this blog to not just talk about education, or challenge the absurd covid narrative; rather, to be interdisciplinary and talk about a multitude of subjects. Since we are in March, I would like to talk about baseball, and since I am also a data nerd – baseball is a good topic in that respect. Baseball is full of statistics, beautiful statistics that tell a story of a player and their abilities. So, for this blog post, I would like to talk about a little-known statistic that I see as the greatest indicator of the best overall player in baseball.
Introducing BOP
BOP stands for Base-Out Percentage and is a new way of understanding offensive output, factoring in hidden, or unattractive statistics. Baseball writer Barry F. Codell suggests the base-out percentage “is baseball’s most complete and informative offensive statistic…it entails everything a player accomplishes individually whenever his team is at bat”. The BOP takes not only every single at-bat into consideration but every plate appearance. For those not all familiar with the terminology – here is a refresher.
At Bat: when a batter reaches base via a fielder’s choice, hit, or an error (not including catcher’s interference) or when a batter is put out on a non-sacrifice.
Plate Appearance: each completed turn batting, regardless of the result.
For example, if Derek Jeter came to the plate 4 times with a single, walk with a stolen base, walk, and a sacrifice fly with a run batted in. His slash-line for the day would be 1-1, 1B, 2BB, SB, SAC, RBI. Now, theoretically, this can happen, and yes one at-bat with a single can result in a stolen base and a potential RBI, especially with a runner on 3rd base. Here is a better one: 0-2, 1BB, SB, R, SAC, RBI with 4 plate appearances. Meaning some combination of, let’s say: strikeout, ground out, walk with a stolen base and a run scored, and a sac fly with a run batted in. What does this say? It says that a player was able to get on base, steal a base, and contribute 2 runs for his team with a .000 batting average for the day. It was in these unattractive stats from a player that contributed 2 runs for his team. This has to be recognized – 2 runs are 2 runs have it be the 0-2 slash line, or a 2-4 1B, 2B, 2RBI.
What the BOP provides is a simple outcome; are you on base or are you in the dugout based on your previous plate appearance? Consider a player like Joey Gallo for a moment. This is no shade on Gallo, but he is considered a 3-outcome player (he walks, he strikes out, or he hits a home run). Striking out keeps you off base, walking without any speed or ability to advance makes you a LOB (runner left on base) stat, which is just as good as an out. All that leaves is the outcome of a home run which is still rare to come by – considering if a good BA is .300, and out of all hits in a season (average 150) 20 are home runs. Roughly only 4 out of 100 at-bats, on average, are home runs. Not ideal for competence with BOP.
How to Calculate BOP
As mentioned, BOP is the statistic misfit that considers all the unattractive baseball stats. Sure there are some impactful stats like Total Bases (TB) and Stolen Bases (SB), but other, less glamorous stats are factored such as Sacrifice Fly (SF) and Sacrifice Hits (SAC), Hit By Pitch (HBP), Caught Stealing (CS), and Ground Into Double Play (GIDP). Below is the formula for BOP.
BOP = TB + BB + HBP + SB + SF + SAC
(AB-H) + SF + SAC + CS + GIDP
The numerator for BOP represents the Bases part of the equation; as in, the number of bases earned including walks, hit by pitch, and stolen bases – also accounting sacrifices for potential run production. The denominator for BOP represents the Outs portion of the equation; as in, the outcomes of an out by At bats subtracting hits, accounting sacrifices as outs, times caught stealing, and times grounded into a double play. Essentially the sacrifices cancel each other out – they represent:
- Yes, you contributed a run or advanced another runner a base.
- No, it is an out and you ended up back in the dugout.
As stated by Cordell “it entails everything a player accomplishes individually whenever his team is at bat”, meaning dependent on how your team, through sacrifices and advancing bases – so too does your BOP number increase. Although team output is important, BOP still relies heavily on individual output considering the stats relate to how one individual reaches base. But as per the example previous, we can see that a player can potentially provide offensive output without reaching base at all.
BOP and the 2022 Baseball Season
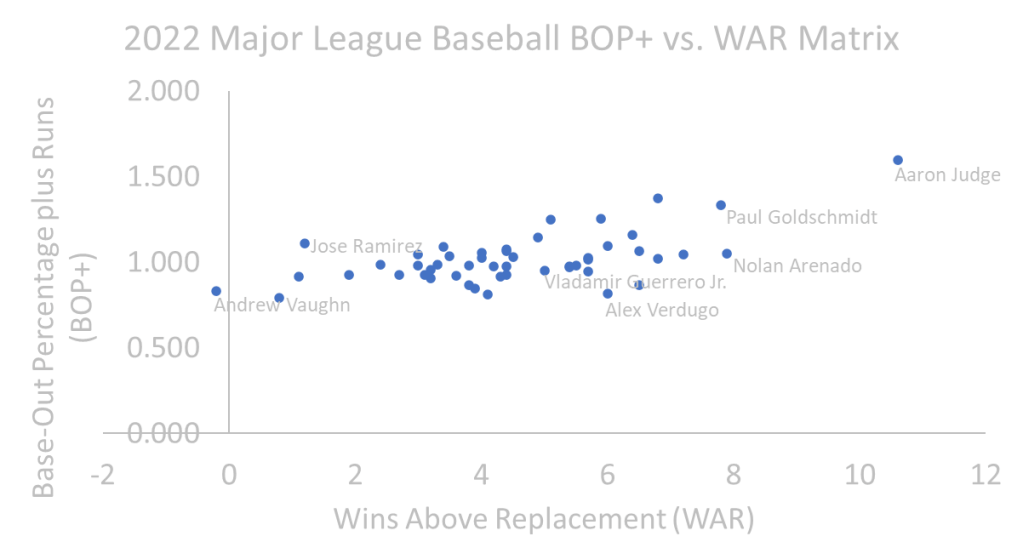
I set out to see how this BOP statistic is actualized using data from the 2022 season. I took the league’s 50 top hitters based on batting average and compared their WAR to their BOP numbers. For a refresher, Wins Above Replacement (WAR) is a common metric indicating a player’s overall prowess on the baseball field. It essentially means, how many wins did this player contribute to his team above a standard replacement player? Also meaning, if a player can have an 11.0 WAR (which is legendary) that means compared to a replacement player (0 WAR) this player provided ten wins above that replacement player based on classical statistics (Hits, Average, RBI, Home Runs, etc.).
When looking at the WAR stat I found something curious, although it considers stolen bases, the formula seems to be heavily dependent on power numbers and removes some of the key factors for BOP. Some interesting results were found.

We see anomalies like Aaron Judge leading the pack far and above with WAR and BOP, considering his historic season, with a .311 BA with an OPS of 1.111, 62 HR, and 131 RBI – leading to an American League MVP award. We also have National League MVP Paul Goldschmidt score high on the matrix batting .317 with 35 HR, and 115 RBI. Even though BOP acknowledges ‘the unknown stat’ it still takes into account power numbers, considering these numbers raise key BOP stats such as TB and BB (many power hitters draw walks).
However, other interesting factors are shown. Consider Luiz Arraez and Jeff McNeil who were both the AL and NL Batting Champions respectively landing in the middle of the pack. Arraez had a .316 average and McNeil had a .326 average as well – where the low BOP comes into play is the significant lack of power numbers (8 and 9 home runs respectively), lack of stolen bases (both had 4 stolen bases), and the inability to draw walks compared to other top performers (50 and 40 walks respectively). Consider Vladamir Guerrero Jr. putting up All-Star numbers 35 HR, 97 RBI, and .818 OPS but ending up in the middle of the BOP v. WAR matrix. It could be because he hit into 26 double plays (leads all the test subjects) and was caught stealing or picked off 3 times that season.
Consider Andrew Vaughn with a -2 WAR and Alex Verdugo with a 6 WAR. Vaughn has a higher BOP because he had no stolen bases, but was not picked off either. As opposed to Alex Verdugo who hit into 14 double plays and has 3 caught stealing to 1 stolen base; meaning, he was a net -2 on the basepaths that season. As a manager, you would hope he would just hit a home run or flyout rather than hit a single and be on the base paths.
Now, I know I picked on Joey Gallo before and he only played 82 games in 2022, but let’s see where he stands with BOP. His BOP for playing 82 games was not bad posting a .617 BOP and a 0.2 WAR. Perhaps one error with this statistic is that it can produce a deceptive number with limited games played considering Gallo missed 80 other opportunities to hit into double plays, get picked off, or draw more walks. However, this stat is a measure of offensive output, and Gallo was paid to be an offensive performer with his power bat. It is interesting that other utility-type players, not known for offensive production, produced more beneficial offensive outcomes compared to Gallo – even when extrapolating to an entire season.
All Time WAR and All Time BOP
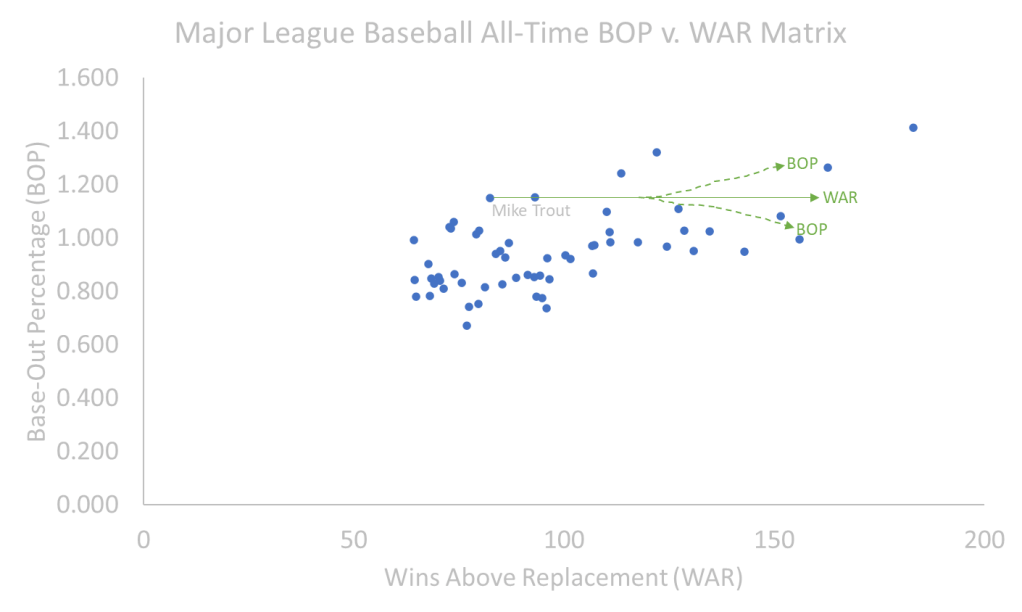
How might BOP be acknowledged on a larger scale when we look at all-time statistics? I took the top offensive WAR players of all time and compared them in a BOP v. WAR matrix – below are the results.

Much like the single-season performers, there is an upward trend in the relationship between BOP and WAR. Babe Ruth made himself the anomaly with the highest BOP and WAR. However, many have said Barry Bonds (even before his steroid use) was one of the best players ever, if not the best player ever. With that said, using the BOP statistics, Bonds still has a high BOP comparable with Lou Gehrig, but performing under Ted Williams for example – even though Bonds has a higher WAR.
Something interesting seems to happen the lower WAR numbers get, the more dispersed the BOP numbers appear. For example, Cal Ripken Jr. has a higher WAR (95.9) compared to Mike Trout (82.4); however, Trout is supreme with a higher BOP (1.150) compared to Ripken Jr. (.735) – what is a contributor to this? The answer is found in the BOP-specific statistics such as Mike Trout already has a career of 204 stolen bases compared to Ripken Jr’s 36 stolen bases. Also note, Trout has only been caught stealing 37 times compared to Ripken Jr’s 39 times – making Trout a net +167 on the base paths and Ripken Jr. a -3. Or even consider the great Willie Mays who boasts a 156.1 WAR – good enough for 3rd all-time – compared to Trout; however, Mays only carries a BOP of .993.
I think the answer to this is that the WAR statistic moves progressively over time; as in, players who play longer at a high to medium level will grow their WAR number year over year. BOP on the other hand is a percentage that can fluctuate drastically year over year and tend to lower as a player’s career progresses. For example, speed and timing dwindle as you get older leading to stolen base attempts with more caught stealing – eventually lowering your BOP. Stretching singles into doubles or doubles into triples become less as you age affecting your total bases. BOP unlike WAR is harder to maintain as a player gets older, considering all the factors as WAR is more of a linear statistic. Below is a potential progression simulation of WAR and BOP for Mike Trout.
But some statistics stand out, notably, Mike Trout has a better ability to get on base through walks than Willie Mays ever did. Also, Mays only had a career net of +235 on the base paths compared to Trout – who is still playing and probably will for another 10 years – already at +167. If Trout were to keep this up, he could potentially have a +330 (estimate) on the base paths predicting 400 stolen bases and 70 caught stealing. If he could do that, his BOP will only get higher. Of course, this is not to take anything from Willie Mays as a player, but if we take out the emotion of our favorite players and objectively look at stats toward offensive output for a team. Regardless of WAR, Trout in this case is already a much better offensive player.
Introducing BOP+
Now, I think BOP is a good statistic and provides clarity on this journey I have taken myself on. With that said, I don’t think BOP tells the whole story. There is still the question I asked at the beginning of this piece “what is the ability of a player to get from the batter’s box to Homeplate in any circumstance”? This is where the BOP+ stat comes in, coined by me. It is the same BOP formula, adding the runs scored stat (R) to the numerator:
BOP+ = TB + BB + R + HBP + SB + SF + SAC
(AB-H) + SF + SAC + CS + GIDP
Not only does a run count for a player every time they hit a home run, but a run also counts if they reach with a single and make it around the bases, if they get hit with a pitch and make it around the bases, or make it to third base to score a run through a sacrifice fly, or even a suicide squeeze. The run stat is the true statistic measuring a player’s ability to get from the batters’ box to home plate. Let’s take the 2022 season again and how it would look with BOP+.

You see similar outcomes with only minor differences. One interesting thing to look at is that Andrew Vaughn’s ability to essentially be safe on the base paths and get home the most efficient way possible gave him a slightly higher BOP+ compared to Alex Verdugo who – according to his stats – was riskier on the base paths, making him less effective to get from batter’s box to home plate.
Looking at all-time stats we see much of the same trends with no real change between the position of players in the BOP matrix compared to the BOP+ matrix. If there is anything it provides, it is that it creates a threshold to consider all-time great players compared to really good players. From the data presented, I feel that the threshold of 1.000 BOP+ can be the difference between an excellent player, and an all-time great player.
***
I think one thing is for certain, BOP is not a perfect statistic, but it does provide a little more clarity relating to the offensive output of a player. Baseball is a team game and the objective of the team is to score more runs than the other team. In that case, we have to consider the BOP statistic to be a factor in determining success based on how players get from the batter’s box to home plate. Additional analysis would be served by putting this on a team level (maybe something for my next article) and see how BOP correlates to team statistics. This could be even more interesting to see if a high Team BOP correlates with team success.
I would conclude that BOP is just as good of an analytical measurement of player success as WAR is. Furthermore, I feel BOP provides a little more depth to a player’s offensive output compared to WAR when factoring negative stats to determine the best all-around offensive players; also, the ability to get from the batter’s box to home plate as an important metric for how players and teams approach the game.
